Contents
About FSRA
About the Annual Information Return
About the 2021 mortgage brokerages and administrators Annual Information Return report
Mortgage brokerages overview
Key observations
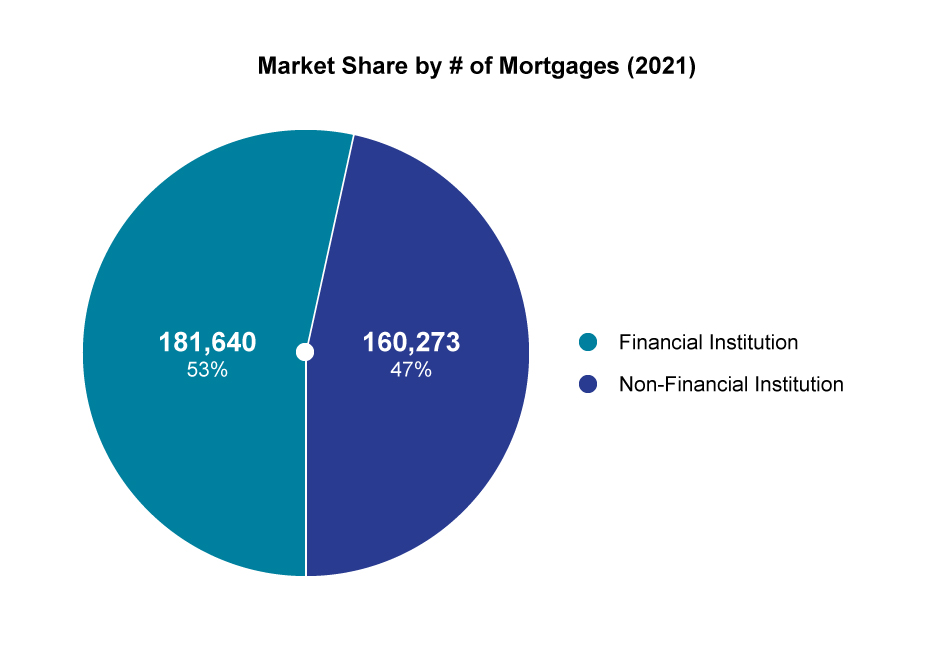
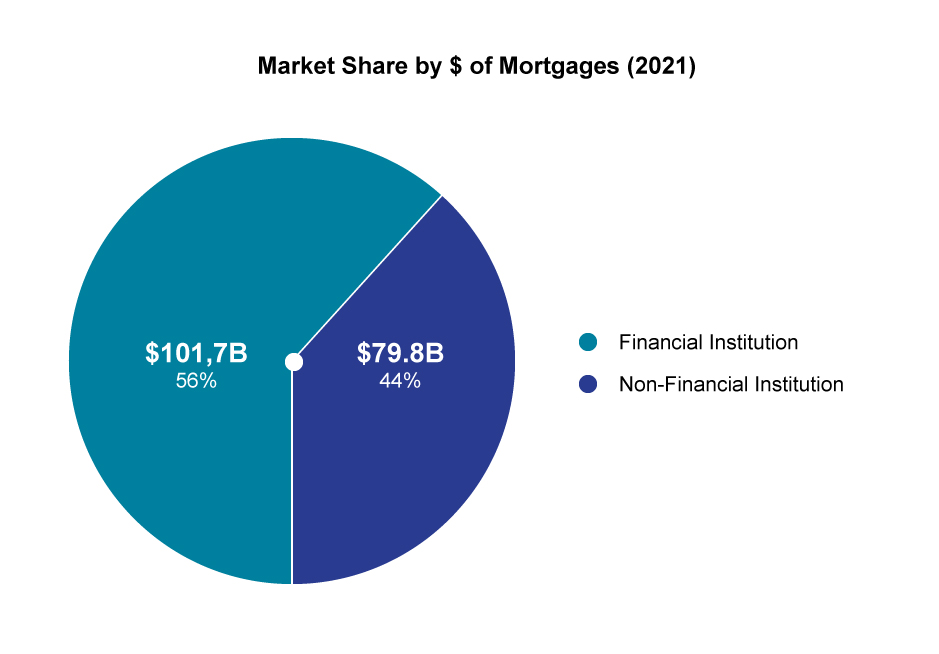
Volume of mortgages
Financial institutions
Banks
Credit Unions
Insurance companies
Trust companies
Non-Financial institution/Alternative lenders
Mortgage finance companies
Self-funding
Mortgage investment corporations
Mortgage investment entities
Private lenders
Other lenders
Non-qualified syndicated mortgages
Mortgage administrators overview
Key observations - Mortgage administrators
Methodology
Appendix
About FSRA
The Financial Services Regulatory Authority of Ontario (FSRA) is an independent regulatory agency created to improve consumer and pension plan beneficiary protections in Ontario.
FSRA is self-funded and capable of responding to the dynamic pace of change in the marketplace, industry and consumer expectations.
About the Annual Information Return
This report summarizes the information provided in the 2021 Annual Information Return (AIR) by licensed mortgage brokerages and administrators about their business activities during the 2021 calendar year.
The AIR collects information about mortgage brokering and administration business volumes, practices, internal controls and market conditions for a calendar year.
Under the Mortgage Brokerages, Lenders and Administrators Act, 2006 (MBLAA), all licensed mortgage brokerages and administrators are required to file the AIR by March 31 of each year, with data for the previous calendar year, even if they did not do any business during that calendar year. Mortgage brokerages and administrators that fail to file the AIR by the March 31 deadline may be subject to summary administrative penalties or other regulatory enforcement action.
The AIR filings help FSRA to better understand the mortgage brokering sector as a whole and assess the overall compliance of mortgage brokerages and administrators with the MBLAA and FSRA’s Guidance.
FSRA uses its understanding of the sector’s business activities, compliance culture and market trends to inform its consumer protection measures, policy direction, the need for guidance to clarify regulatory requirements and regulatory action where there is evidence of non-compliance.
FSRA may flag an entity for examination based on a risk assessment of data elements reported in the AIR. Where examination findings indicate instances of non-compliance, FSRA may take enforcement action as appropriate. Enforcement actions may include Letters of Warning, licence conditions, suspension or revocation of a licence and/or administrative monetary penalties. Repeated instances of non-compliance would result in progressive enforcement action.
All licensed mortgage brokerages and administrators must meet their legal requirements under the MBLAA. FSRA encourages licensed brokerages and administrators to visit the Mortgage Brokering section on FSRA’s website to learn more about their legal obligations.
About the 2021 mortgage brokerages and administrators Annual Information Return report
The 2021 AIR Report (“Report”) provides an overview of the business activities in Ontario’s mortgage brokering and administration sectors based on data collected from brokerages and administrators through the 2021 AIR.
In the 2021 AIR, questions were revised to clarify that only mortgage transactions brokered in Ontario should be reported. Some brokerages had inadvertently included transactions outside of Ontario in previous years’ AIRs. As a result, in 2021, there were some larger-than-expected year-over-year decreases for certain data points[1] (e.g., residential mortgages) as transactions for mortgages brokered on properties outside of Ontario were no longer reported in the 2021 AIR.
The 2021 data reflects AIR responses from:
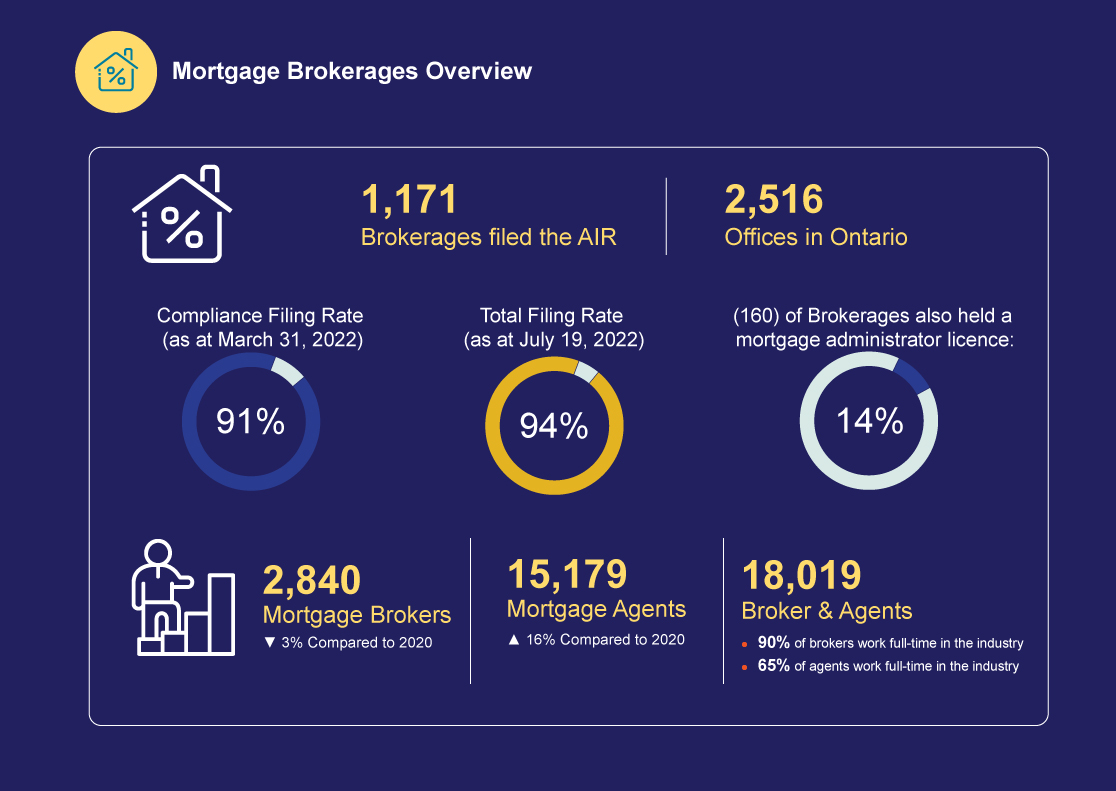
- 1,171 mortgage brokerages (vs 1,179 brokerages in 2020)
- 213 mortgage administrators (vs 205 administrators in 2020)
The compliance rate for filing (i.e., number of licensees filing the AIR by March 31 that are required to file[2]) in 2021 was:
- 91% for mortgage brokerages
- 83% for mortgage administrators
This report focuses on the volume of business (e.g., number and value of mortgages by type of mortgage and lender). It provides licensees and FSRA with key data insights about the mortgage brokering market segments. A summary of the aggregate responses to all the AIR questions is provided in Appendix A.
Mortgage brokerages overview
Image
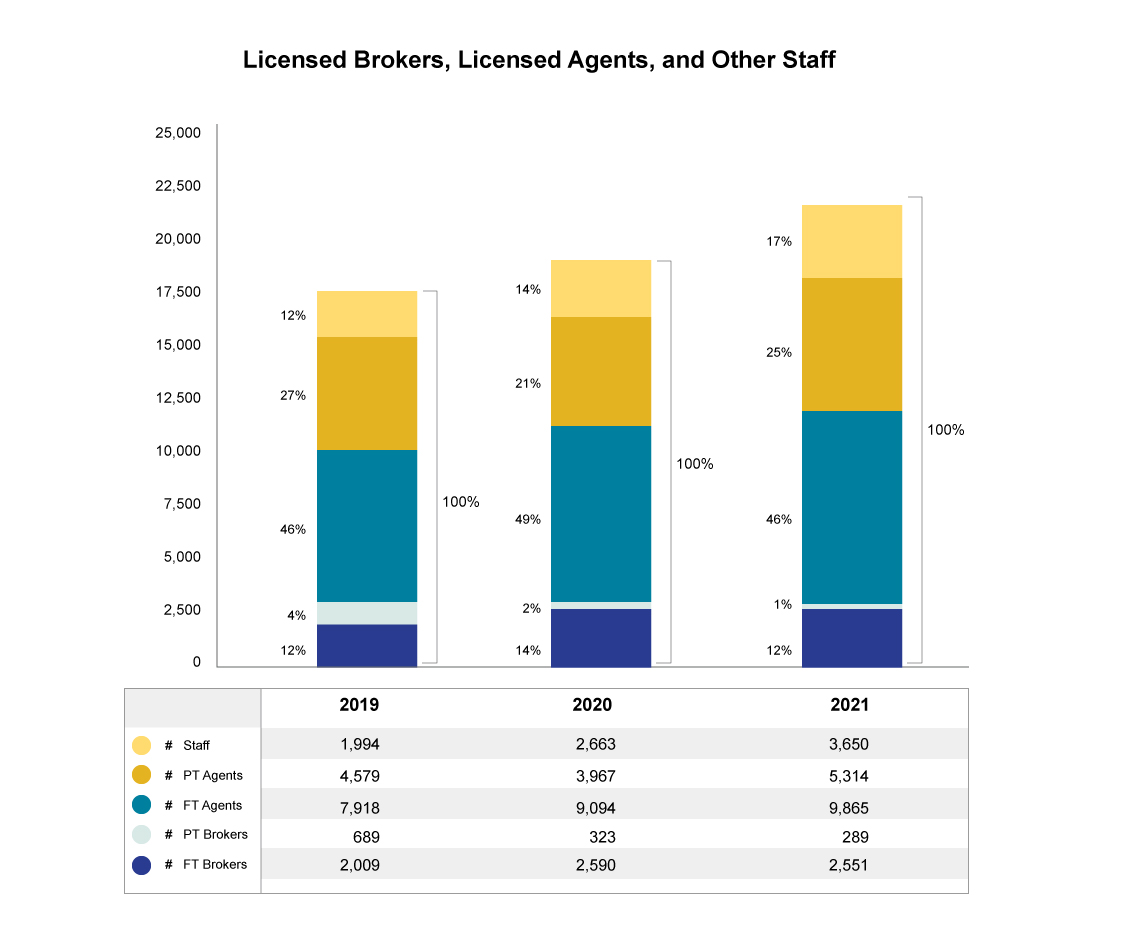
Licensed brokers, licensed agents, and other staff
Image
Key observations
Mortgage Brokerages
- The total dollar value of brokered mortgages rose 12.2% year-over-year in 2021, as a result of record-high residential real estate sales and prices[3]. This was the third consecutive year of double-digit growth.
- There were notable year-over-year increases of 69.9% and 130.6% in the dollar value of Reverse and Qualified Syndicated Mortgages (QSMs), respectively, in 2021.
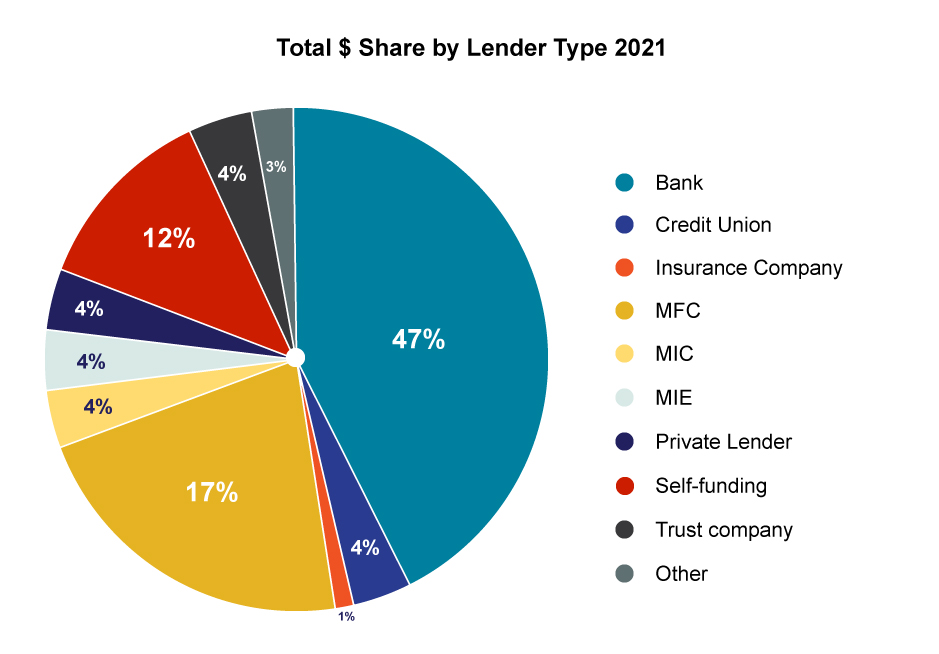
- Banks remained the largest source of mortgage funds for the sector, accounting for 46.7% of the total value and 45% of the total number of brokered mortgages in 2021.
- In the Non-Financial Institutions/Alternative Lender category, Mortgage Finance Companies (MFCs) and Mortgage Investment Corporations (MICs) experienced the greatest year-over-year increases in the dollar value of mortgages funded, up 55% and 38.2%, respectively, in 2021.
Mortgage Administrators
- The total number and dollar value of mortgages under administration increased 1.5% and 12.1% in 2021 from 2020.
Mortgage brokerages overview
Image
Volume of mortgages[4]
Volume of mortgages refers to the number and value of mortgage transactions reported by the sector. The 2021 AIR data revealed the following about the volume of mortgages and sources of funding in Ontario:
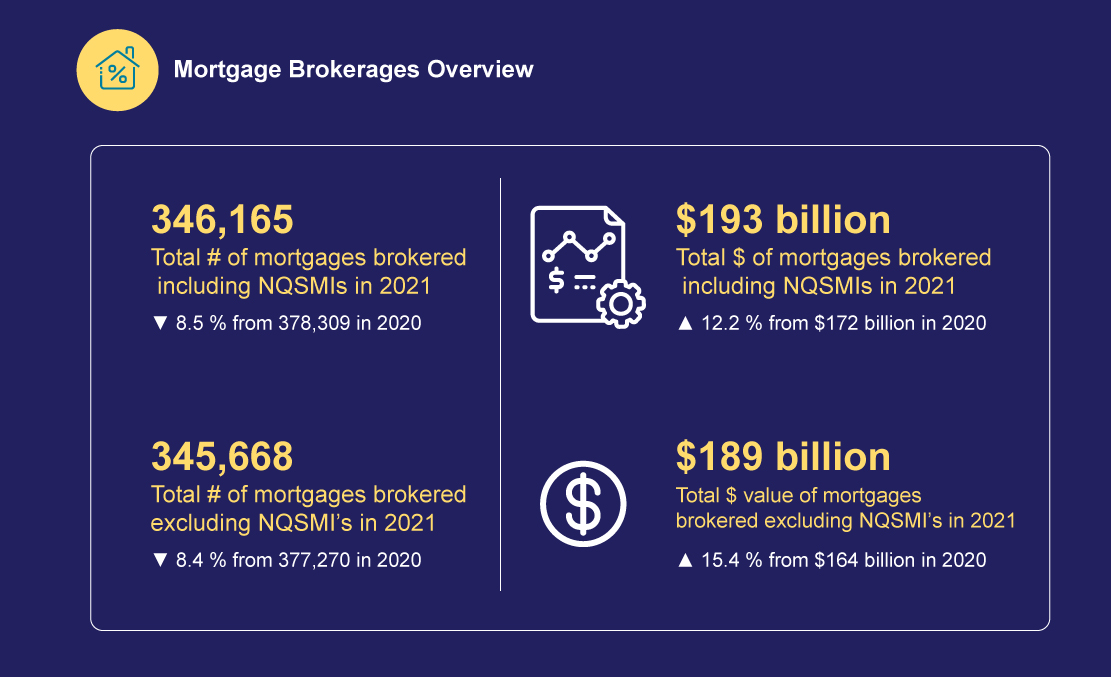
The total dollar value of mortgages arranged increased 12.2% in 2021 to $193 billion from $172.0 billion in 2020 despite a decline in the number of mortgages arranged. The increase in the total value of mortgages primarily reflected an increase in the value of residential mortgages.
The total number of mortgages arranged declined by 8.5% to 346,165 in 2021 from 378,309 in 2020.
Residential
- The value of residential mortgages arranged increased by 12.7% in 2021 to $149.2 billion from $132.4 in 2020 reflecting increased home prices. Residential mortgages account for approximately 81.7% of the total value of brokered mortgages and 98.5% of the total number of brokered mortgages.
- The number of residential mortgages arranged decreased by 9.4% to 337,328 from 372,164 in 2020, despite 2021 being a record year for Canadian residential home transactions.
- The average size of a residential mortgage rose to $442,216 in 2021 from $355,791 in 2020.
Commercial
- The value of commercial mortgages arranged increased by 8.2% in 2021 to $32.2 billion from $29.8 billion in 2020. Given the typically larger values of commercial mortgages, these loans accounted for approximately 17.7% of the total value of brokered mortgages and 1.4% of the total number of brokered mortgages.
- The number of commercial mortgages decreased by 0.7% to 4,797 in 2021 from 4,833 in 2020.
Other mortgages[5]
- The dollar value of other mortgages arranged decreased by 53.9% in 2021 to $820 million from $1.8 billion in 2020.
- The number of other mortgages decreased by 1.8% to 268 in 2021 from 273 in 2020.
Conventional[6]
- The value of conventional mortgages (residential, commercial and other) rose 33.5% in 2021 to $145.6 billion from $109.1 billion in 2020. The number of conventional mortgages rose 15.9% to 275,470 over the same period. The average conventional mortgage dollar amount rose 15.1% in 2021 to $528,680 from $459,181 in 2020.
Insured and uninsured high ratio
- The value of insured high-ratio mortgages declined 43.5% in 2021 from 2020 to $29.4 billion, reflecting a 59.3% decline in the number of these mortgages. In contrast, The average insured high-ratio mortgage dollar amount rose 38.8% in 2021 to $555,859 from $400,496 in 2020 The value of uninsured high-ratio mortgages rose 13.6% in 2021 from 2020 to $3.0 billion despite a 19% decline in the number of uninsured mortgages. The average uninsured high-ratio mortgage dollar amount rose 40.2% in 2021 to $403,409 from $287,691 in 2020. Default insurers place a $1,000,000 limit on the purchase price of a home they will insure. Given the increase in home prices, homes previously eligible for default insurance, no longer qualify. This partially explains the increase in the value of uninsured high-ratio mortgages.
Secondary mortgage classifications
The Secondary Mortgage Classifications in the AIR are intended to help further our understanding of specific market segments. These classifications in the AIR include the following types of mortgages:
- Qualified Syndicated Mortgage (QSM)
- First-time Home Buyer (FTHB)
- Construction and development
- Reverse
- Sub-prime[7]
- Home Equity Lines of Credit (HELOC)
The above classifications are not-mutually exclusive. That is, a mortgage can be classified as both a First-time Home Buyer and Sub-Prime mortgage and would be counted in both of these secondary classifications. In addition, some mortgages may not fall within any of the secondary classifications (e.g., it’s not a FTHB, reverse or construction and development mortgage, etc.). Mortgages that do not fall within a Secondary Classification are, however, included in the overall total of mortgages. Hence, the total volume of the Secondary Mortgage Classification may not add to the same total as that for all mortgages.
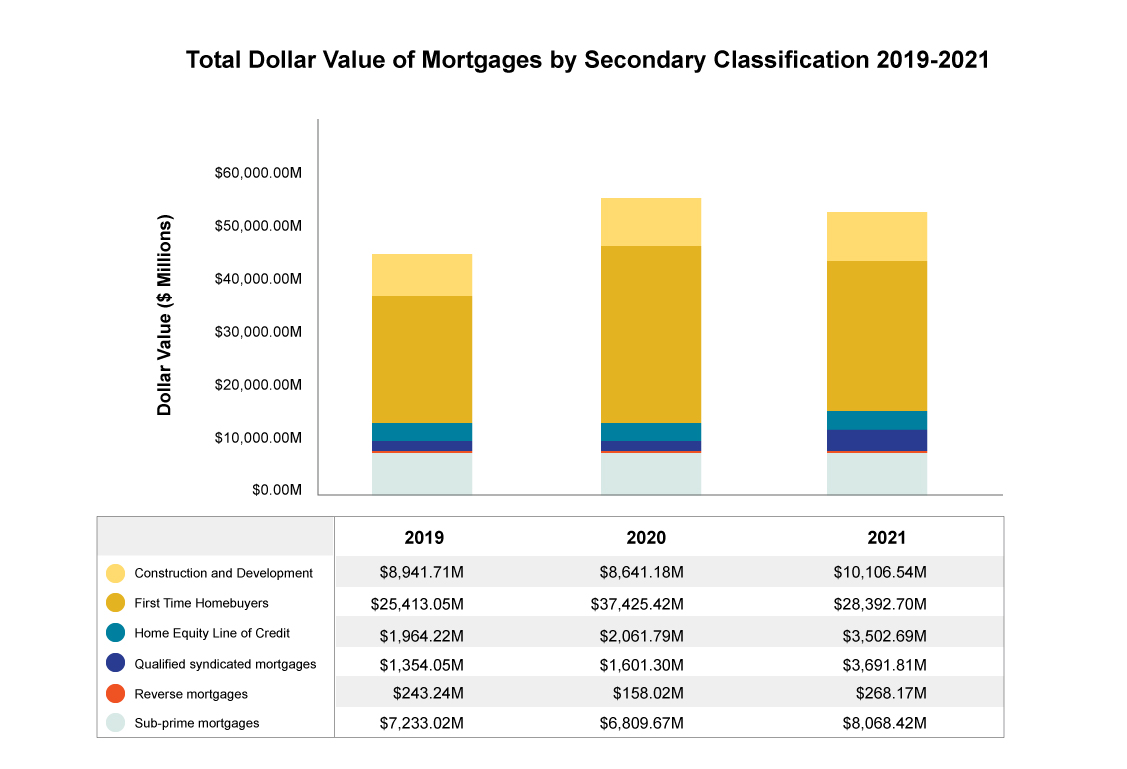
- There were strong increases in QSMs, Reverse mortgages and Home Equity Lines of Credit (HELOCs) in 2021 from 2020.
- The value of QSMs rose by 130.6% in 2021 from 2020 to $3.7 billion. The number of QSMs rose by 57% in the same period to 6,708.
- The value of reverse mortgages increased by 69.7% in 2021 from 2020 to $268.2 million. The number increased by 64.1% over the same period to 837 (up 65% since 2016).
- The value of HELOCs rose by 69.9% in 2021 from 2020 to $3.5 billion. The number of HELOCs rose by 49.9% over the same period to 9,896 (up 37% since 2016).
- These upward trends likely reflect homeowners leveraging the increased values of their homes to meet various goals (e.g., aging at home, gifting down payments to children or grandchildren, renovation).
- The value of construction and development mortgages rose 17.0% to $10.1 billion in 2021 from 2020.The number of construction and developments mortgages rose by 23.6% in 2021 from 2020 to 1,763.
- The value of FTHB mortgages decreased by 24.1% in 2021 from 2020 to $28.4 billion. The number of first-time homebuyer mortgages declined 28.3% in 2021 from 2020 to 58,035.
- The value of sub-prime mortgages rose by 18.5% in 2021 from 2020 to $8.1 billion. The number of sub-prime mortgage transactions remained level with a marginal increase of 0.1%.
Image
Sources of lending
Image
Financial institutions
Banks
Banks remained the largest source of funding for brokered mortgages by number and dollar value of mortgages in 2021.
Banks accounted for 46.7% of the total value and 45% of the total number of brokered mortgages in 2021.
The value of mortgages funded by banks rose 27.1% in 2021 to $84.7 billion from 2020, while the number of mortgages funded by these financial institutions increased marginally by 0.8% to 153,776 in 2021.
The number of brokerages using banks to fund mortgages increased by 2.9% to 633 in 2021 from 615 in 2020.
Credit unions
The value of mortgages funded by credit unions rose 58.9% in 2021 to $7 billion from 2020, while the number of mortgages funded by credit unions increased by 37.6% to 11,456 in 2021.
The number of brokerages using credit unions to fund mortgages increased by 10.3% to 365 in 2021 from 331 in 2020.
Insurance companies
The value of mortgages funded by insurance companies rose 7.2% in 2021 to $1.8 billion from 2020, while the number of mortgages funded by insurance companies increased by 7.2% to 403 in 2021.
The number of brokerages using insurance companies to fund mortgages decreased by 30.3% to 46 in 2021 from 66 in 2020.
Trust companies
The value of mortgages funded by trust companies decreased by 28.4% in 2021 to $8.2 billion from 2020, while the number of mortgages funded by trust companies decreased by 13.4% to 16,005 in 2021.
The number of brokerages using trust companies to fund mortgages decreased by 1.8% to 376 in 2021 from 383 in 2020.
Image
Image
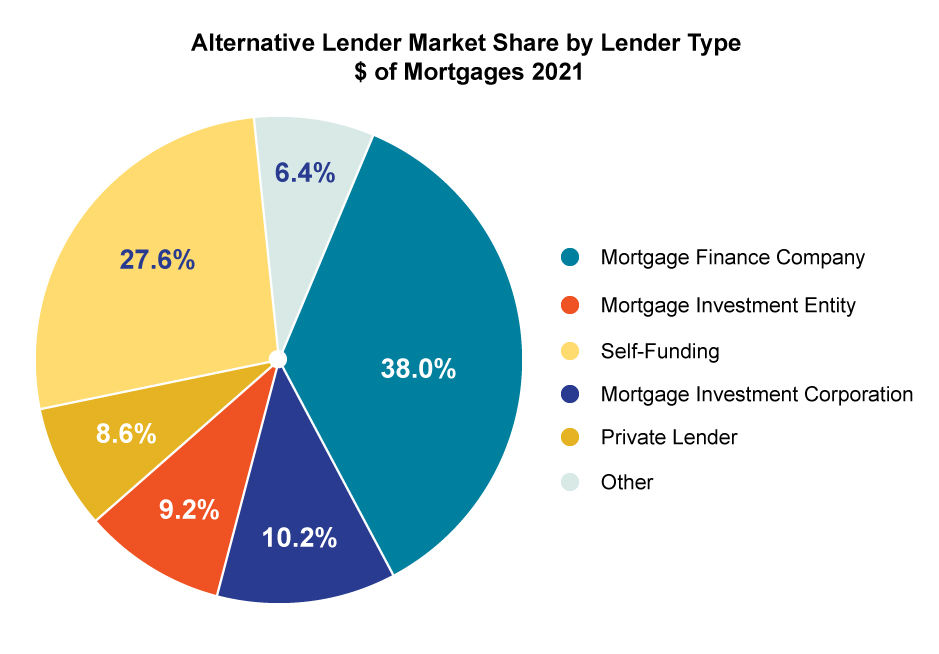
Non-Financial institution/Alternative lenders
Non-Financial Institution/Alternative Lenders are generally non-deposit-taking entities (and individuals). They provide mortgages to consumers through the mortgage brokering sector.
FSRA collects information about alternative lending through the AIR. Brokerages report their use of alternative lenders, which are categorized in the AIR as follows: MFCs, Self-funding (licensed mortgage brokerages funding their own mortgages), MICs, Mortgage Investment Entities (MIEs)[8], Private Lenders (entities and individuals) and Other.
Mortgage finance companies[9]
MFCs were introduced as a category of Non-Financial Institution/Alternative Lender in the 2019 AIR. Prior to 2019, FSRA observed that mortgage brokerages reported funding through MFCs across various lender categories (i.e., not reported consistently in one category of lender). The addition of MFCs as a distinct lender category will support a better understanding of MFC lending in the market. These lenders are typically licensed mortgage brokerages that engage in mortgage lending using their own funds.
In 2021, the value of mortgages funded by MFCs rose 55% from 2020 to $30 billion. The number of mortgages funded by these entities rose 36% from 2020 to 66,585.
MFCs accounted for the second largest share of brokered mortgages in 2021. MFCs accounted for 19% (66,585) of the total number of brokered mortgages in 2021 versus a 13% share in 2020. Similarly, their share of the total value of mortgages rose to 17% ($30 billion) in 2021 from 12% in 2020.
The number of brokerages who reported using MFCs rose 7.9% in 2021 from 2020 to 463.
Self-funding
In 2021, the value of mortgages self-funded by brokerages declined by 48% from 2020 to $22 billion. The number of mortgages funded by these licensees declined by 52.6% from 2020 to 54,683[10].
Self-Funding fell to the third largest source of mortgage funds in 2021 from the second largest in 2020, as its market share nearly halved in 2021. Self-Funding accounted for 16.2% of the total number and 12.1% of the total value of mortgages in 2021 versus 31% and 26% market share, respectively, in 2020.
The number of brokerages reporting Self-Funding declined 34.1% in 2021 from 2020 to 89[11].
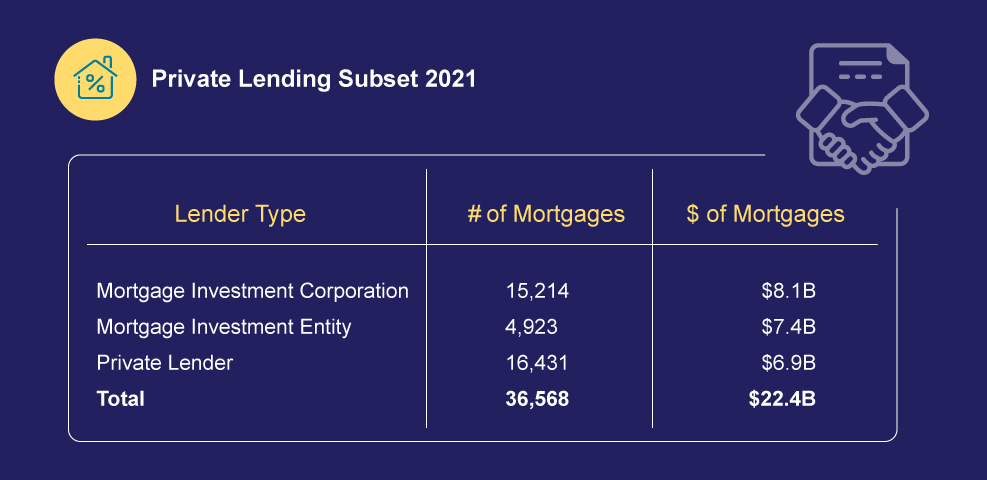
Mortgage investment corporations[12]
In 2021, the value of mortgages funded by MICs rose 38.2% from 2020 to $8.1 billion. The number of mortgages funded by MICs rose 27.1% from 2020 to 15,214.
MIC’s market share of the number of total mortgages funded rose to 4.4% in 2021 from 3.2% in 2020. Their share of the total value of mortgages remained rose to 4.5% in 2021 from 3.4% 2020. This suggests an increasing number of brokerages/borrowers turned to MICs for funding of smaller value loans.
The number of brokerages using MICs in 2021 rose 22.1% from 2020 to 437.
Analysis of the MIC names used by brokerages indicates that there were more than 180 different MICs that funded mortgages in 2021.
Mortgage investment entities[13]
MIE was introduced as a category of non-bank lenders in the 2021 AIR. Prior to 2021, FSRA observed that mortgage brokerages reported funding through MIEs across private lenders and MIC lender categories.
The addition of MIE as a distinct lender category will support a better understanding of this lender category in the market.
In 2021, MIEs funded $7.4 billion in mortgages representing approximately 4.1% of total value of mortgage broker transactions.
Private lenders[14]
The value of mortgages funded by Private Lenders (individuals and entities) decreased by 9.5% in 2021 from 2020 to $6.9 billion despite a 1.9% increase in the number of mortgages they funded in 2021 to 16,431.
The share of funding by Private Lenders shifted slightly in 2021 from 2020 (at 3.8% of the total value and 4.8% of the total number of mortgages).
The number of brokerages using Private Lenders declined by 3.3% in 2021 from 2020 to 504.
Analysis of the names of Private Lenders used by brokerages to fund mortgages indicated there were more than 2,200 unique Private Lenders in 2021. Over 72% of these were names of individuals (vs entities).
Although mortgages funded by MICs and private lenders are not a large proportion of the total mortgage market, given their unregulated underwriting practices, FSRA’s supervision priorities for 2021-22 included a review of brokerages working with these alternative lenders. Relative to mortgages from Financial Institutions, mortgages from Alternative Lenders generally have higher loan-to-value or loan-to-income ratios. These lenders may also be more willing to lend to borrowers who are less financially resilient. FSRA will continue to monitor this segment as part of its 2022-2023 supervisory plan to ensure brokers and agents are properly assessing the suitability of these alternative mortgages for a client when presenting them as options for the client.
Other lenders[15]
The value of mortgages funded by Other Lenders increased by 17.9% in 2021 from 2020 to $5.1 billion. The number of mortgages funded by these lenders deceased by 53.6% in 2021 from 2020 to 1,562.
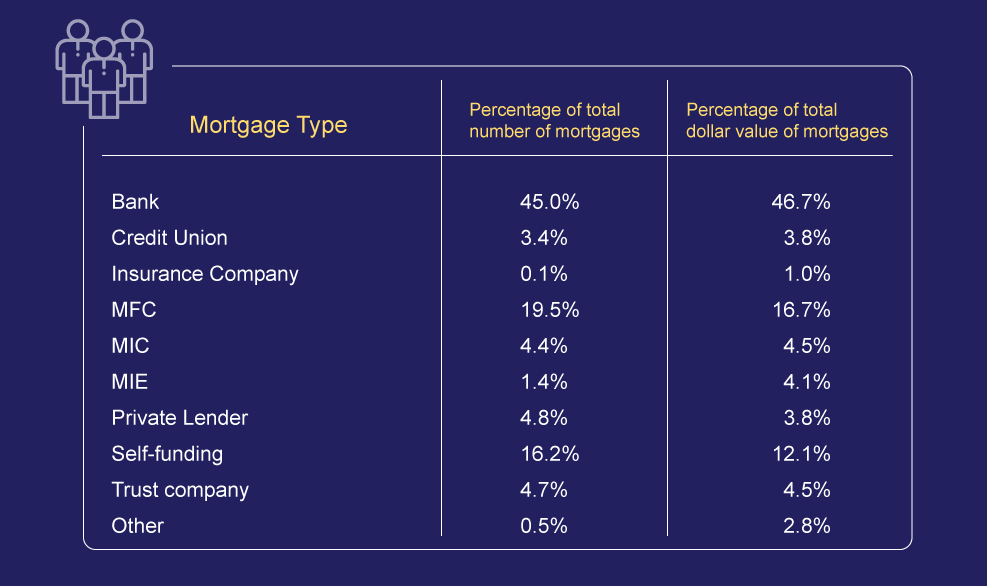
| Total Mortgages | Alternative Lender Mortgages | |||
|---|---|---|---|---|
| Mortgage type | Share of total number of mortgages | Share of total value of mortgages | Share of the number of alternative lender mortgages | Share of the value of alternative lender mortgages |
| Bank | 45.0% | 46.7% | Na | Na |
| Credit union | 3.4% | 3.8% | Na | Na |
| Insurance Company | 0.1% | 1.0% | Na | Na |
| MFC | 19.5% | 16.7% | 41.5% | 38.0% |
| MIC | 4.4% | 4.5% | 9.5% | 10.2% |
| MIE | 1.4% | 4.1% | 3.1% | 9.2% |
| Private lender | 4.8% | 3.8% | 10.3% | 8.6% |
| Self-funding | 16.2% | 12.1% | 34.7% | 27.6% |
| Trust company | 4.7% | 4.5% | Na | Na |
| Other | 0.5% | 2.8% | 1.0% | 6.4% |
Image
Private lending subset 2021
Image
Image
Image
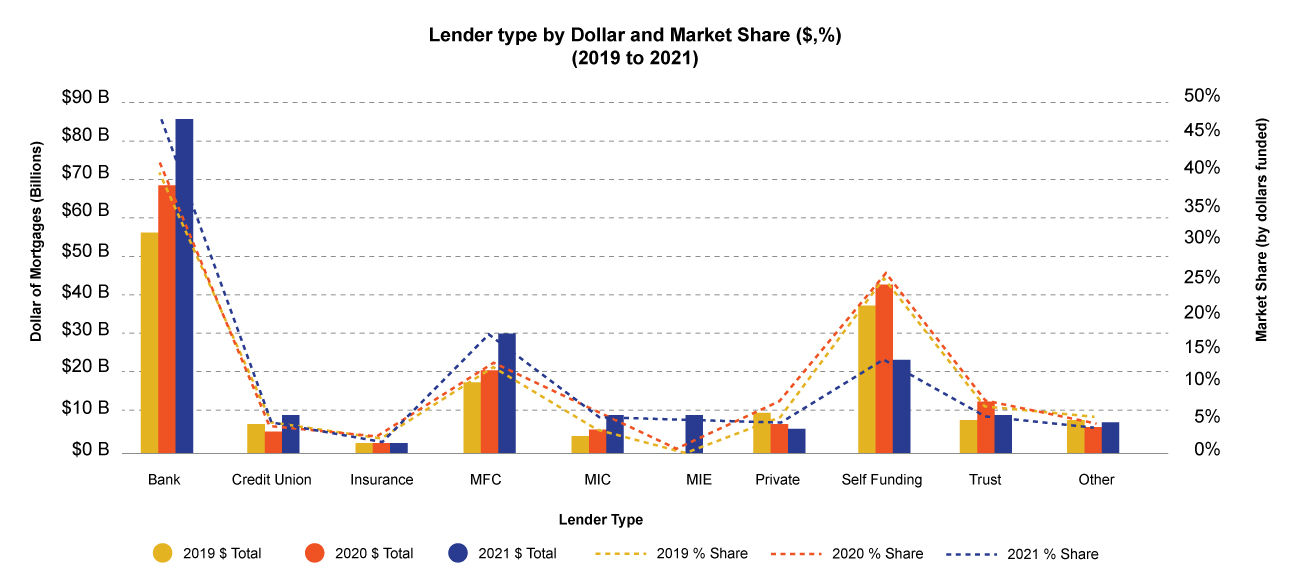
| Dollar of Mortgages (Billions) | Market Share (by dollars funded) | |||||
|---|---|---|---|---|---|---|
| Lender Type | 2019 | 2020 | 2021 | 2019 % Share | 2020 % Share | 2021 % Share |
| Bank | $55.0B | $66.6B | $84.7B | 39.4% | 40.6% | 46.7% |
| Credit Union | $5.5B | $4.4B | $7.0B | 3.9% | 2.7% | 3.8% |
| Insurance | $2.0B | $1.7B | $1.8B | 1.4% | 1.0% | 1.0% |
| MFC | $15.8B | $19.6B | $30.3B | 11.3% | 11.9% | 16.7% |
| MIC | $3.6B | $5.9B | $8.1B | 2.6% | 3.6% | 4.5% |
| MIE | $7.4B | 4.1% | ||||
| Private | $9.4B | $7.6B | $6.9B | 6.7% | 4.6% | 3.8% |
| Self-Funding | $35.1B | $42.4B | $22.0B | 25.2% | 25.9% | 12.1% |
| Trust | $7.0B | $11.5B | $8.2B | 5.1% | 7.0% | 4.5% |
| Other | $6.2B | $4.3B | $5.1B | 4.4% | 2.6% | 2.8% |
| Total | $139.5B | $164.0B | $181.5B | 100% | 100% | 100% |
Non-qualified syndicated mortgages
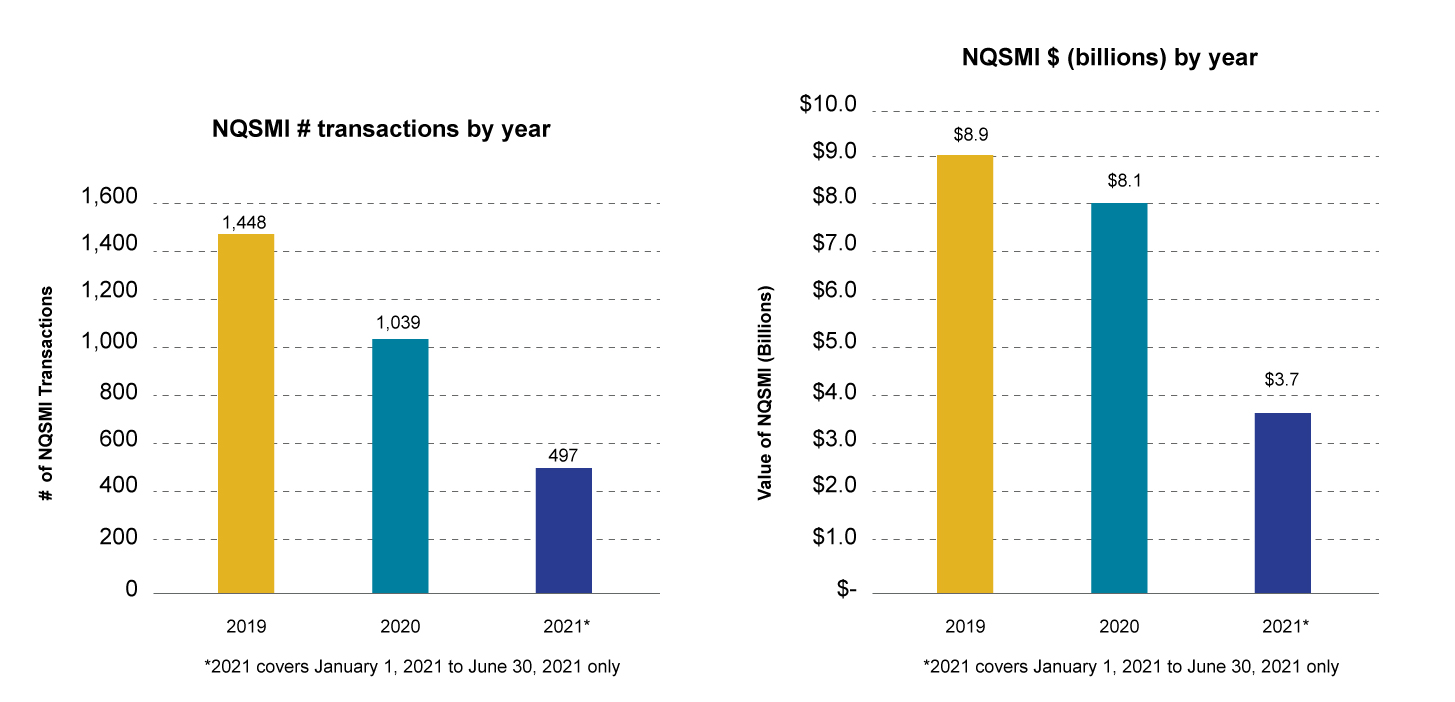
Effective July 1, 2021, oversight of certain NQSMIs was transferred to the Ontario Securities Commission (OSC). That is, new NQSMI transactions with Non-Permitted Client investors/lenders fall under the OSC’s oversight effective that date; and FSRA retains oversight of new NQSMI transactions with Permitted Client investors/lenders, except where specific exemptions apply.
As a result, brokerages were required to report and provide data specific regarding their NQSMI transactions that occurred between January 1 2021 to June 30, 2021.
Between January 1, 2021 to June 30, 2021:
- 50 brokerages reported transacting in NQSMIs (vs 57 in calendar 2020).
- These brokerages reported transacting in 497 NQSMIs totalling $3.7 billion. This compares to 1,039 NQSMIs totalling $8 billion in calendar 2020.
Annualized, the number (994) and value ($7.4 billion) of NQSMI transactions in 2021 represent decreases of 4% and 7%, respectively, from calendar 2020.
The decrease in the number and value of NQSMI transactions may be attributed to the transfer of regulation of certain NQSMIs to the OSC and continued fallout from high-profile syndicated investment failures. Additional information on the data collected from the first NQSMI Quarterly Report has been published in the 2nd Edition of the FSRA MB Newsletter.
Image
Mortgage administrators overview
Image
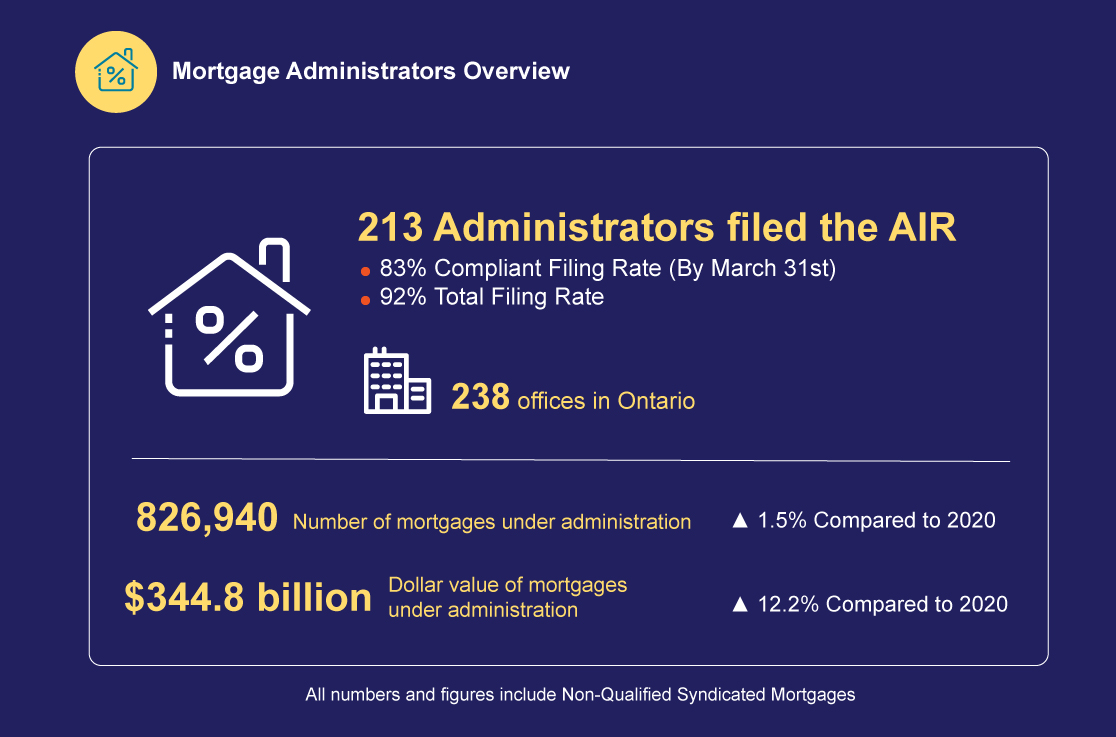
Key observations – Mortgage administrators
The number of mortgage administrators rose 3.9% in 2021 from 2020 to 213.
The number of mortgages under administration rose 1.5% in 2021 from 2020 to 826,940 and the dollar value of mortgages under administration rose 12.2% in 2021 from 2020 to $344.8 billion.
28% of mortgage administrators (59) reported that they administered NQSMIs.
The number of NQSMI’s under administration decreased 30.8% in 2021 from 2020 to 1,244 and the dollar value of mortgages under administration decreased by 10.9% in 2021 from 2020 to $10.6 billion.
46% of mortgage administrators (98) reported that they administered private mortgages.
Methodology
Filing period: The 2021 AIR filing period ran from January 24, 2022 to March 31, 2022. Submissions received after July 19, 2022 are excluded from this report. The 2021 AIR data reflects mortgage brokerage and administrator volumes during the 2021 calendar year.
Error detection: Edits are applied at the micro level. Data was subjected to quality checks to detect errors that appear to be clear and obvious or significantly different for the prior year’s filings.
Data accuracy: AIR data was collected from licensed mortgage brokerages (94%) and mortgage administrators (92%) who were required to file a 2021 AIR. Entities filed their AIRs electronically. AIR data may be subject to human error during data entry.
Information reported in the AIR is subject to data validation checks and FSRA follows-up with brokerages and administrators as needed. To validate aggregate data collected in the AIR, comparative analysis is performed against external data from sources such as Teranet, Canada Mortgage and Housing Corporation (CMHC), and Statistics Canada.
Appendix
Appendix data [XLSX]
[1] Large year-over-year decreases due to change in reporting were noted for: residential mortgages, conventional mortgages, first mortgages, insured high-ratio mortgages, new loans, first-time home buyer mortgages and self funding.
[2] The denominator excludes the number of licensees that surrendered their licences.
[3] CREA, 2021 Annual Report
[4] As per the note in the About the 2021 Mortgage Brokerages and Administrators Annual Information Return Report section of this Report, the 2021 AIR questionnaire clarified that only Ontario business activities should be reported in the AIR. This change likely resulted in larger-than-expected declines in the volume of mortgages for some data points.
[5] Other mortgages are those not included as residential or commercial (e.g., hobby farm, raw land not under development).
[6] In the 2021 AIR, a Conventional mortgage is defined as having a Loan to Value Ratio less than or equal to 80%
[7] In the 2021 AIR, a sub-prime mortgage is defined as a mortgage for individual(s) with a mean credit score of 600 points or less.
[8] This is a new category beginning with the 2021 questionnaire.
[9] A Mortgage Finance Company is a non-depository financial institution that underwrites, and services mortgages sourced through brokers.
[10] Same comment as footnote 3.
[11] In 2021 AIR self-funding did not include mortgages funded by brokers or agents own funds.
[12] Mortgage Investment Corporation (MIC): An investment/lending company designed specifically for mortgage investing or lending, in Canada, and governed by the Income Tax Act (Canada).
[13] Mortgage Investment Entity (MIE), Other than MIC: A MIE is a mortgage-financing business that pools together money from investors to lend on mortgages. MIEs can vary in organizational structure, and may be a trust, a limited partnership or a corporation.
[14] Private Lender: A person or business, other than a MIC or MIE, who lends their own funds for a mortgage including individual mortgage brokers or agents. (Brokerages that lend their own funds are self-funding)
[15] Other lender category captures lenders that mortgage brokerages were unable to classify.