< Back to Annual Business Plan Table of Contents
Financial Information
The FY2021-22 FSRA budget was developed to support FSRA’s mandate to be an empowered, principles-based regulator. It enables FSRA to fulfill its regulatory requirements and address its key priorities in its third year of operations.
The schedule below presents FSRA’s Board-approved budget for April 1, 2021 to March 31, 2022, a comparison to the prior year, and plans for the next two fiscal periods.
|
($000's) |
FSRA F20-21 Budget |
FSRA F21-22 Budget |
FSRA F22-23 Plan |
FSRA F23-24 Plan |
|
| Activity Fees | 10,337 | 8,954 | 9,500 | 10,200 | |
| Fee Assessment | 74,097 | 74,814 | 77,000 | 82,200 | |
| Licensing Fees | 13,457 | 12,332 | 13,500 | 13,800 | |
| Other* | 1,502 | 3,961 | 4,000 | 3,700 | |
| Total Revenue | 99,393 | 100,061 | 104,000 | 109,900 | |
| YoY change | 0.7% | 3.9% | 5.7% | ||
| Direct Costs | 55,937 | 58,500 | 59,361 | 61,472 | |
| Common Costs | 43,456 | 45,443 | 47,139 | 48,428 | |
| Total Costs | 99,393 | 103,943 | 106,500 | 109,900 | |
| YoY change | 4.6% | 2.5% | 3.2% | ||
| Recovery Over /(Under) | - | (3,882) | (2,500) | - | |
| Funding from F19-20 Excess Revenue Over Cost | 3,882 | 2,500 | |||
| Net Balance | - | - | - | - | |
| *HSP under recovery and FPFA revenue | |||||
Please refer to page 53 for the details of FY2022-24 plans.
The FY2020-21 budget is the Board-approved 12-month budget and is presented for comparison purposes. As of October 2020, FSRA is forecasting a favorable $7-10 million variance to the FY2020-21 plan, largely due to a number of human capital vacancies. Once the variance is confirmed through external audit, FSRA will conduct a determination of whether to reduce borrowing requirements, repay loans, or reduce future sector assessments to minimize increases. The outcome of this analysis and the Board’s decision will be disclosed to stakeholders.
FY2021-22 Board-Approved Budget
FSRA proposes a $103.9 million cost budget for FY2021-22 to achieve its mandate and stated priorities. The chart below presents the net increase of budgeted costs compared to the FY2020-21 cost and revenue budget.
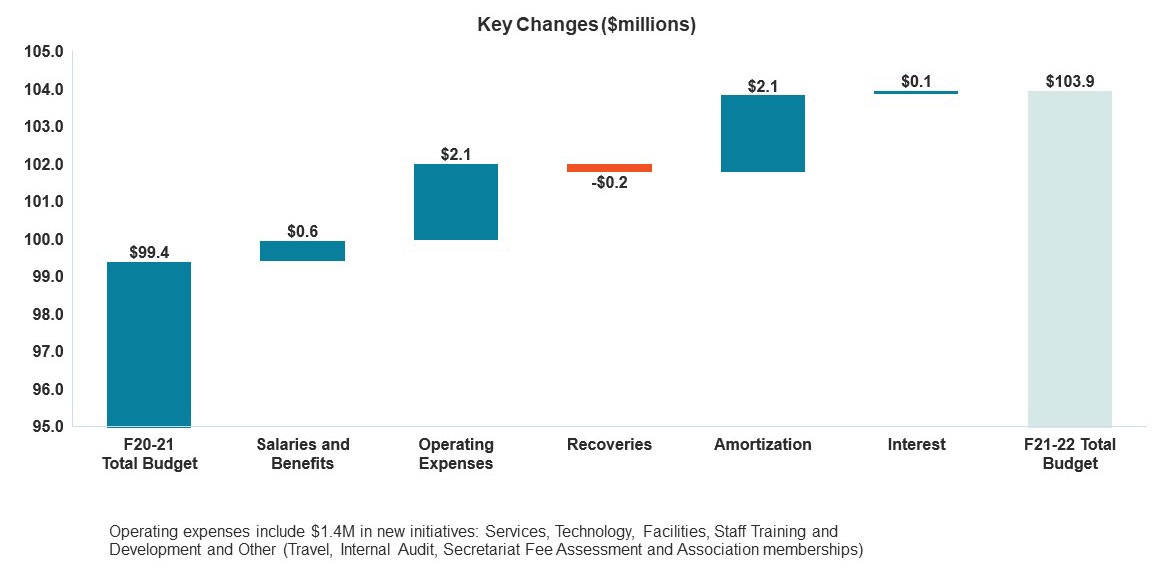
To deliver on its priorities FSRA will invest an additional $1.7 million in human capital resources in FY2021-22. This investment will improve FSRA’s capabilities in sectoral and functional expertise. Executive leadership have identified specific regulation/supervisory areas that require resourcing. FSRA will increase investments in supervisory oversight life agents and auto enforcement. Further investments will be made in credit union resolution and recovery capabilities due to the increased risk presented by the COVID-19 pandemic and ensuing economic stress. Investments to replace the inadequate core IT systems will continue. These investments are offset by cost efficiencies of $0.8 million through managing staffing deployments in direct sector activities and back-office support functions and $0.3 million in human capital savings in the regulation of individual pension plans. Overall payroll costs will increase by $0.6 million.
The $2.1 million increase in operating expenses includes investments to support FSRA’s commitment to improve regulation, investments to address auto insurance data analytics initiatives, and investments in a credit union Risk-Based Supervisory Framework. It also includes PBGF stochastic (probability-based) modelling to assess adequacy of the fund and to manage SEPP risks more effectively. Additional investments include consumer communication initiatives and IT operations.
Third-party cost recoveries decreased by $0.2 million, primarily due to lower recoveries from Financial Services Tribunal and Motor Vehicle Accident Claims Fund.
Amortization increased by $2.1 million. This was primarily due to a digital transformation amortization cost increase of $1.2 million. These expenditures are intended to achieve targeted investments in core regulatory and back-office technology.
The core regulatory digital transformation expenditure of $6.0 million planned for FY2021-22 is a significant IT system investment that is focused on sector burden reduction and efficiencies in the future. The non-GAAP deferral of technology investment expenses is incurred in the current year but charged to sectors over five years to match the costs and benefits. This results in a $4.8 million deferral. The investment will provide benefits to sector participants by improving digital reporting and return filing. This will also allow the accessing of real-time information and reduced cycle time on licence applications. The systems will allow FSRA to move to a principle-based regulator, replacing administrative and human capital effort with technology-based analytical and risk-based activities. FSRA’s benefits include up-to-date secure, scalable platforms that will be the basis of process transformation.
The amortization for facilities expenses increased by $0.9 million. That was due to the commencement of leasehold improvement amortization and the completion of the rent-free period at 25 Sheppard West facility. This enables FSRA to operate more effectively both in and out of the office.
FSRA will draw on the existing loan facility of approximately $3 million in FY2021-22 for core regulatory systems and office re-location, resulting in $0.1 million higher interest costs.
FSRA budgets total sector revenues showing a net increase of 0.7 per cent or $0.7 million over the FY2020-21 budget. The variable sectors fee assessment component of these total revenues increases by 1.0 per cent. This increase is after accounting for the anticipated reduction in revenues for fixed fee/activity fees. The assessment fee increase is limited to 1.0 per cent by crediting $3.9 million of FY2019-20 excess revenues over costs back to the sectors in FY2021-22.
(Please view in full screen to see below table)
| Sector ($000's) | Insurance | Pensions (Fixed and Variable) | Credit Unions (Variable) | Mortgage Brokers (Fixed) | Loans & Trusts (Variable) | Financial Advisor & Financial Planner | Total | |||||||
| Subsector | Auto Products | Health Service Providers (Fixed) | P&C Conduct | P&C Prudential Regulation |
Total Auto/ HSP/ P&C |
Life & Health Conduct (Variable) | Life & Health Conduct (Fixed) |
Total Life & Health | ||||||
| F2021-2022 Revenue | ||||||||||||||
| Activity Fees | 3,327 | 3,327 | 5,627 | 5,627 | 8,954 | |||||||||
| Fee Assessment | 19,360 | 10,234 | 524 | 30,118 | 4,395 | 4,395 | 26,105 | 15,551 | 106 | 2,500 | 78,775 | |||
| Licensing Fees | - | - | 12,332 | 12,332 | ||||||||||
| F2021-22 Budget Rev | 19,360 | 3,327 | 10,234 | 524 | 33,444 | 4,395 | 5,627 | 10,023 | 26,105 | 15,551 | 12,332 | 106 | 2,500 | 100,061 |
| Direct Cost | 10,411 | 1,875 | 5,966 | 306 | 18,558 | 2,563 | 3,172 | 5,734 | 15,220 | 9,843 | 7,664 | 62 | 1,409 | 58,489 |
| Common Cost | 9,563 | 1,452 | 4,619 | 237 | 15,871 | 1,984 | 2,456 | 4,440 | 11,783 | 6,288 | 5,933 | 48 | 1,091 | 45,454 |
| F2021-2022 Cost | 19,974 | 3,327 | 10,586 | 542 | 34,428 | 4,546 | 5,627 | 10,174 | 27,003 | 16,132 | 13,597 | 109 | 2,500 | 103,943 |
| Recovery Over/(Under) | (614) | - | (352) | (18) | (984) | (151) | - | (151) | (898) | (581) | (1,266) | (4) | - | (3,882) |
| Funding from F19-20 Excess Revenues Over Costs | 614 | - | 352 | 18 | 984 | 151 | - | 151 | 898 | 581 | 1,266 | 4 | - | 3,882 |
| F2020-21 Budget Revenue | 20,668 | 4,284 | 11,532 | 211 | 36,694 | 2,380 | 5,679 | 8,059 | 27,074 | 13,453 | 13,457 | 57 | 599 | 99,393 |
| Revenue Variance Fav/(Unfav) | (1,308) | (957) | (1,298) | 314 | (3,250) | 2,015 | (52) | 1,963 | (968) | 2,098 | (1,125) | 49 | 1,902 | 668 |
| -6.3% | -22.3% | -11.3% | 148.9% | -8.9% | 84.6% | -0.9% | 24.4% | -3.6% | 15.6% | -8.4% | 86.7% | 317.7% | 0.7% | |
| F2020-2021 Cost | 20,112 | 5,278 | 11,735 | 214 | 37,339 | 2,422 | 5,779 | 8,201 | 27,549 | 13,690 | 11,957 | 58 | 599 | 99,393 |
| Cost Variance F21-22 vs F20-21 Fav/(Unfav) |
139 | 1,951 | 1,149 | (328) | 2,911 | (2,124) | 152 | (1,973) | 547 | (2,442) | (1,640) | (52) | (1,902) | (4,551) |
| 0.7% | 37.0% | 9.8% | -153.0% | 7.8% | -87.7% | 2.6% | -24.1% | 2.0% | -17.8% | -13.7% | -89.8% | -317.7% | -4.6% | |
2022-23 Plan
The FY2022-23 plan indicates expenses $2.6 million higher than the FY2021-22 Board- approved budget. Salaries and benefits increase $2.5 million due to the requirements of the collective agreements. The investment of seven new full-time equivalents (in FY2022-23 will provide FSRA the necessary resources to build supervisory capacity to oversee the life agents and MGAs. This is offset by $0.9 million FTE efficiencies resulting from digital transformation investments.
The amortization expense increase of $2.1 million is driven by digital transformation and operating investments in current and prior years.
The $2.5 million of FY2019-20 excess revenues over costs will be used to reduce the FY2022-23 fee assessment.
2023-24 Plan
The FY2023-24 plan indicates expenses $3.4 million higher than the FY2022-23 plan. Salaries and benefits increase $1.4 million due to the requirements of the collective agreements. The investment of six new FTE in FY2023-24 will continue providing FSRA the necessary resources to build supervisory capacity to oversee the life agents and MGAs.
Through the core regulatory digital investments, FSRA will realize efficiencies of $0.9 million in salaries and benefits. FSRA will continue to seek efficiencies through operational effectiveness and technology to potentially mitigate future FTE growth.
The amortization expense increase of $2.0 million is primarily due to the amortization of core regulatory digital investments in current and prior years.
Capital
The FSRA capital program is aligned with its strategy of reducing regulatory burden and improving the effectiveness of regulation. Consistent with FSRA’s priorities, significant investments in technology and processes are included. FSRA’s FY2020-21 priorities include reviewing legacy guidelines, processes and technology that FSRA has inherited. Therefore, FSRA expects the capital program to evolve significantly as it determines a more detailed strategy and plans for a technology-enabled regulatory transformation.
|
($000's) |
Investment F2020-21 |
F2021-22 Budget |
F2022-23 Plan |
F2023-24 Plan |
|
| Software | 240 | 430 | 400 | 400 | |
| Computer hardware | 850 | 1,143 | 1,100 | 1,100 | |
| 25 Sheppard - Renovation | 11,945 | ||||
| 25 Sheppard - Furniture | 500 | ||||
| 25 Sheppard - Data Centre and IT set up | 470 | ||||
| 12,915 | |||||
| Digital Transformation | 170 | ||||
| Capital Assets - In Year/Prior Years | 14,175 | 1,573 | 1,500 | 1,500 | |
| 25 Sheppard built-out amortized over 10 years (term of lease) | |||||
| Hardware - amortized over 3 years | |||||
| All other assets - amortized over 5 years | |||||
FSRA will be making significant investments in core system digital transformation over the next few years. There will be a recovery of this investment from the sectors over a rolling five-year period, peaking in FY2024-25, in of $7.2 million. The schedule below estimates the FY2021-24 investment in IT and how it will be recovered from the sectors through budgeted costs.
|
($000's) |
F2020-21 Budget |
F2021-22 Budget |
F2022-23 Plan |
F2023-24 Plan |
| Digital Transformation | 3,681 | 6,021 | 9,200 | 9,000 |
| Workday | 850 | |||
| Total Operating Investments | 4,531 | 6,021 | 9,200 | 9,000 |
| Amortization | ||||
| From F2020-21 | 906 | 906 | 906 | 906 |
| From F2021-22 | 1,204 | 1,204 | 1,204 | |
| From F2022-23 | 1,840 | 1,840 | ||
| From F2023-24 | 1,800 | |||
| From F2024-25 | ||||
| Total Amortization | 906 | 2,110 | 3,950 | 5,750 |
Cash Flow and Borrowings
The following chart illustrates FSRA’s cash flow and borrowings through FY2023-24. The cash flow statements reflect the funding provided through the MOF/OFA for start-up and other identified requirements, including capital funding, and is illustrated below.
|
(000's) |
|
|
|
F2021-22 Budget |
F2022-23 Plan |
F2023-24 Plan |
| Cash inflow from operations | $ 5,333 | $ 8,948 | $ 13,308 | |||
| Operating investments | (6,021) | (9,170) | (8,967) | |||
| Capital investments | (1,573) | (1,573) | (1,573) | |||
| (7,594) | (10,743) | (10,539) | ||||
| Net increase / (decrease) in borrowing | (419) | (3,623) | (3,623) | |||
| Net decrease in cash flows | (2,680) | (5,418) | (855) | |||
| Cash balance - beginning of year | 57,472 | 54,792 | 49,374 | |||
| Cash balance - end of year | $ 54,792 | $ 49,374 | $ 48,520 | |||
The ending cash balances above have been adjusted to reflect the collection of fees in advance of the start of the next fiscal year (i.e., fees for a fiscal year will be collected in February/March before the fiscal year begins).
Debt repayment is amortized over 17 to 20 years with the objective that all loans mature in approximately 20 years from June 2019 at interest rates between 2.8 per cent and 3.4 per cent. The following table summarizes anticipated borrowings.
|
(000's) |
||
| Initial Loan Draw | $ 27,000 | |
| Additional draw by March 31, 2019 | 13,000 | |
| Loan draw at March 31, 2019 | 40,000 | Amortized over 20 years |
| Anticipated 2019-20 Draw | 6,853 | Amortized over 19 years |
| Projected 2020-21 Draw | 4,500 | Amortized over 18 years |
| Projected 2021-22 Draw | 3,000 | Amortized over 17 years |
| Total | $ 54,353 |
Excess cash may be used for debt repayment where deemed appropriate.